Monthly Archives: April 2013

Excuses, excuses

Most of us have done it at some time—when given negative feedback we become defensive and find excuses for the actions that are being criticised, or we turn it around and criticise those who are criticising us. Criticism is never easy to take. It’s an understandable reaction, and one that is just as common in organisations as it is in individuals.

A decade or so ago I was working for a large unitary authority when its first Comprehensive Performance Assessment (CPA) results were announced. They had been rated as ‘weak’—the second lowest of five possible ratings. Rather than acknowledge the failings and focus on how to improve, the initial response of the the Leader of the Council was to brand the decision as unfair and criticise the Audit Commission’s approach to assessment1.

More recently, the Francis Inquiry into the Mid Staffordshire NHS Foundation Trust noted that the Trust has failed to take notice of multiple warning signs and found a culture of defensiveness, inward looking and lack of openness to criticism to be major contributors to the extensive problems there. The report observes:

The Trust’s culture was one of self promotion rather than critical analysis and openness… It took false assurance from good news, and yet tolerated or sought to explain away bad news (para 1.7)2

and continues:

…the Trust was an organisation that lacked insight and awareness of the reality of the care being provided to patients. It was generally defensive in its reaction to criticism and lacked openness with patients, the public and external agencies (para 1.114)3

Denying criticism may not always lead to the atrocious failures that happened in Mid Staffordshire, where some reports estimate up to 1,200 patients may have died as a result4, but it is surely not the action of an organisation focused on learning and continual improvement.

Kolb's cycle of learning

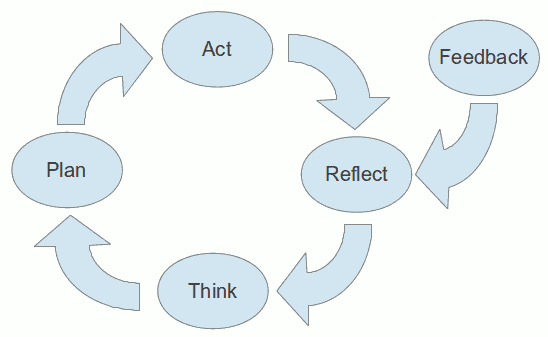
Feedback informing Kolb’s cycle of learning
(adapted from Kolb5)

Feedback is a vital part of learning, whether that be for individuals or organisations. It illuminates our blind areas and increases our self-awareness6. It helps us to identify areas that need improvement that we may otherwise have missed. It can provide valuable information for reflection, feeding in to and complementing the cycle of learning described by Kolb7 (see figure). Today’s environment is in a constant state of change and organisations cannot afford not to be learning8. This requires an outward focus—the rest of the world is an essential learning resource—and a willingness to learn from mistakes9. Feedback, both good and bad, represents valuable external knowledge and a successful organisation will recognise this and be able to assimilate and apply that knowledge10. Organisations that have a strong learning culture accept negative feedback as willingly as they do positive feedback and use it as a source of reflection with a view to improving. In contrast, organisations that deny the validity of negative feedback are unlikely to learn from it and miss a valuable opportunity.

This is not to say that the targets of regulators and inspection bodies are always right. I’ve already noted some of the adverse effects that targets can have on organisational performance. But it would be foolish to throw out the baby with the bathwater. Even amongst a collection of seemingly meaningless targets the feedback about why those targets were missed may provide valuable intelligence that will help improve services further. Even if you don’t believe that what is being measured is useful, this does not mean that there are not valuable lessons that can be learnt from the process. The good organisation will not focus solely on the regulators’ targets—it will have its own more rounded concepts of excellent service delivery, seeing hitting targets as merely a by-product of being good at its core purpose. It will use any and all feedback that it can get to feed into the process of working out how to get better at that purpose.

Of course, getting negative feedback is not easy for employees who have worked hard to deliver a service. It is the job of leaders to maintain morale and to support the staff through this. This is not achieved by being defensive or drawing inwards. In the long term this only means the certainty of disappointing results next time too, and it sets a poor example for individuals’ learning. The leader’s role is to encourage, not stifle, learning11. Leaders need to work to establish a culture of continuous development, to emphasize the positives that can be drawn from learning and to motivate and empower employees to work together to find new solutions12. They should not be making excuses. They should put up their hands and admit the mistakes, and ask how they can do better next time.

  1. ‘Good’ – but not good enough (2002). Nottingham Evening Post, 12 December, p 20 []
  2. Francis, R (2013). Report of the Mid Staffordshire NHS Foundation Trust Public Inquiry: executive summary. [Online]. London: The Stationery Office. Available from: http://www.midstaffspublicinquiry.com/sites/default/files/report/Executive%20summary.pdf [Retrieved 23 April 2013] []
  3. Francis, R (2013). Report of the Mid Staffordshire NHS Foundation Trust Public Inquiry: executive summary. [Online]. London: The Stationery Office. Available from: http://www.midstaffspublicinquiry.com/sites/default/files/report/Executive%20summary.pdf [Retrieved 23 April 2013] []
  4. Smith, R (2009). NHS targets ‘may have led to 1,200 deaths’ in Mid-Staffordshire. The Telegraph [Online], 17 March. Available from: http://www.telegraph.co.uk/health/healthnews/5008442/NHS-targets-may-have-led-to-1200-deaths-in-Mid-Staffordshire.html [Retrieved 24 April 2013] []
  5. Kolb, DA (1984). Experiential learning: experience as the source of learning and development. Englewood Cliffs, NJ: Prentice-Hall []
  6. Luft, J (1982). “The Johari Window: a graphic model of awareness in interpersonal relations.” In: Porter, LC and Mohr, B (eds) NTL Reading Book for Human Relations Training [Online]. pp 32–35. Available from: http://www.library.wisc.edu/edvrc/docs/public/pdfs/LIReadings/JohariWindow.pdf [Retrieved 21 April 2013] []
  7. Kolb, DA (1984). Experiential learning: experience as the source of learning and development. Englewood Cliffs, NJ: Prentice-Hall []
  8. Behn, RD (1998). What right do public managers have to lead? Public Administration Review, 58 (3): 209–224 []
  9. Davies, HTO and Nutley, SM (2000). Developing learning organisations in the new NHS. British Medical Journal, International edition, 320 (7240): 998–1001 []
  10. Lane, PJ, Koka, BR and Pathak, S (2006). The reification of absorptive capacity: a critical review and rejuvenation of the construct. The Academy of Management Review, 31 (4): 833–863 []
  11. Broussine, M (2009). “Public leadership.” In: Bovaird, T and Löffler, E (eds) Public management and governance. 2nd ed [Online]. Abingdon: Routledge. pp 261–277. Available from: MyiLibrary. http://lib.myilibrary.com/Open.aspx?id=197798 [Retrieved 10 October 2012] []
  12. Heifetz, RA and Laurie, DL (1997). The work of leadership. Harvard Business Review, 75 (1): 124–134 []

Time to crowd source performance management?

Public sector targets have been getting a bad press recently. Speaking about the Mid-Staffordshire hospital scandal, David Cameron told Parliament that the Francis Inquiry blamed

…a focus on finance and figures at the expense of patient care—he says that explicitly—underpinned by a preoccupation with a narrow set of top-down targets pursued, in the case of Mid Staffordshire, to the exclusion of patient safety1

And it’s not just the NHS. In November 2012 five Kent police officers were arrested for allegedly manipulating crime figures2, a practice that research by a former police officer suggests is just one of several ways used by the police to game targets3.

That targets can lead to gaming, distortion and unwanted results is not a new discovery. Target setting dominated Soviet Union economic planning for 60 years and plenty has been written on the way that targets were gamed there4. So why are they still around?

Well firstly because they appear to work. For example, despite the widespread evidence of gaming in the NHS during the New Labour era, there is also evidence that targets did play a part in bringing down waiting times5, and they were certainly implicated in some impressive economic growth in the Soviet Union. But a more compelling reason for at least some form of performance measurement is accountability. Public bodies act on behalf of the public, spending public money to provide services that the public want or need. It is not unreasonable to expect that they should be able to demonstrate that they are doing this in an effective and efficient manner—that their performance should be measured and that they be taken to task if it is not up to par. Is there a better way to achieve this?

The operations of public bodies are complex, with multiple, potentially competing objectives sometimes covering many areas. Trying to sum up performance with a small number of measures requires a degree of aggregation6 which hides detail. It makes by and large flawed assumptions about the ability to judge the whole by looking at a part7, allowing the situation where an organisation both hits its targets and delivers abysmal levels of service. The use of clear, prescriptive methods for measuring lends itself to gaming and manipulation of the figures. The process of audit is wrapped in information asymmetry—the organisation being audited knows far more about its workings than the body doing the auditing. But what if public bodies were expected to work on the basis of completely open books, publishing for public scrutiny as much data about their performance and operations as could be accomplished whilst still respecting issues of data protection?

With all the data out in the public domain aggregation is reduced. It becomes possible to spot differences in performance in different areas of the organisation’s operations. There is less reliance on reporting only small parts of the story. To an extent a reverse information asymmetry is introduced—there is no prior knowledge of who will look at which area of the data when or how, making gaming extremely difficult. Organisations would be incentivised to ensure that all their figures showed good service, not just those they know they will be judged on. Eric Pickles has already said he wants an army of armchair auditors scrutinising local government accounts8, but why stop at finance? The digital era and modern management information systems make this level of transparency possible for the first time. There are examples from around the globe of increased transparency leading to corruption being uncovered by citizens9; it’s time to extend that to poor performance.

Of course, I am not suggesting that all responsibility for performance management be crowd sourced. Monitoring performance, reviewing information, learning from it and improving systems as a result, is the job of managers. But introducing the possibility of scrutiny by citizens or peers can do much to overcome the weaknesses of the current approach. Such change represents not just a major shift in culture towards greater transparency, but a shift in attitude towards how data are used, from the terror of sanctions to a more learning focused culture based on intelligence gathering10. It allows an organisation to concentrate on learning how best to deliver its services, instead of how best to hit it targets. The two are rarely the same thing.

  1. Hansard (2013). House of Commons. Wednesday 6 Feb 2013 [Online]. Available from: http://www.publications.parliament.uk/pa/cm201213/cmhansrd/cm130206/debtext/130206-0001.htm#13020677000972 [Retrieved 24 April 2013] []
  2. Laville, S (2012). Kent police officers arrested over crime statistics ‘irregularities’. The Guardian [Online], 15 November. Available from: http://www.guardian.co.uk/uk/2012/nov/15/kent-police-arrested-statistics-irregularities [Retrieved 24 April 2013] []
  3. Patrick, R (2009). Performance management, gaming and police practice: a study of changing police behaviour in England and Wales during the era of new public management [Online]. PhD thesis, University of Birmingham. Available from: http://etheses.bham.ac.uk/534/ [Retrieved 23 April 2013] []
  4. Bevan, G and Hood, C (2006). What’s measured is what matters: targets and gaming in the English public health care system. Public Administration, 84 (3): 517–538 []
  5. Hood, C (2006). Gaming in targetworld: the targets approach to managing British public services. Public Administration Review, 66 (4): 515–521 []
  6. De Bruijn, H (2006). Managing Performance in the Public Sector. 2nd ed. London: Routledge []
  7. Bevan, G and Hood, C (2006). What’s measured is what matters: targets and gaming in the English public health care system. Public Administration, 84 (3): 517–538 []
  8. Department for Communities and Local Government (2010). Eric Pickles ‘shows us the money’ as departmental books are opened to an army of armchair auditors [Online]. Available from: https://www.gov.uk/government/news/eric-pickles-shows-us-the-money-as-departmental-books-are-opened-to-an-army-of-armchair-auditors [Retrieved 19 November 2012] []
  9. Bertot, JC, Jaeger, PT and Grimes, JM (2010). Using ICTs to create a culture of transparency: E-government and social media as openness and anti-corruption tools for societies. Government Information Quarterly, 27 (3): 264–271 []
  10. Hood, C (2007). Public service management by numbers: Why does it vary? Where has it come from? What are the gaps and the puzzles? Public Money & Management, 27 (2): 95–102 []

Does size matter?

Writing on the INLOGOV blog a few months back, Catherine Staite argued that it’s time to start talking about merging smaller councils, asking

How can we justify the inefficiencies and unnecessary overheads of two tier areas and tiny unitaries in the current financial climate – when cuts are having a real impact on the most vulnerable?1

But is the assumption that big is better necessarily true? With Britain’s largest council, Birmingham City Council, in dire financial straits2 perhaps it’s time to question the belief that larger authorities are more efficient.

When two small district councils, Babergh and Mid Suffolk, considered whether they should merge they compiled a detailed business case which suggested that a merger would save council tax payers around £1.8m annually across a combined general fund budget requirement of around £20m3. What is conspicuous by its absence in that business case is any discussion of the impact that merging might have on outcomes. The implicit assumption appears to be that outcomes will remain the same, thus allowing the reduced costs to be claimed as efficiency. Let’s consider some of the reasons why this might not be the case.

Allocative efficiency

To explain what I mean by allocative efficiency, we’ll look at an almost topical example. To keep our food bill down we achieve economies of scale by buying a lot of our food in bulk from a wholefood wholesaler. A few weeks ago we were compiling our bi-monthly order and with Easter approaching we wondered whether we should buy a box of six chocolate eggs. It would have saved us a fair bit on buying eggs individually from a retailer. The problem is that the nephews like their chocolate sweet and milky, we prefer it dark and at least 70% cocoa, and the in-laws are partial to a spot of white chocolate. So buying a crate of identical eggs would have meant that most people didn’t have the chocolate experience they would have liked. We’d have pushed down our inputs, but outcomes would have suffered.

This is a very real danger with merging authorities. A bigger council may enable economies of scale, but economies of scale assume that the same service is right for everyone. Different areas have different problems, different populations and different aspirations. The ability of a council to respond to the preferences of its citizens should sit at the heart of any measure of performance4 and smaller, more decentralised units may provide better opportunities for greater responsiveness56.

Leadership and staff engagement

During my career in local government I’ve worked for both a large unitary and a small district. The contrast in the culture of the two organisations, and in my sense of engagement and ability to influence outcomes, could hardly be more marked—I was far happier in the small district. It would be foolish to generalise from this one personal observation and there may be many factors other than organisational size involved. Nevertheless, there is evidence that transformational leadership is more prevalent in smaller organisations7 and there is evidence that transformational leadership enhances staff commitment, engagement and performance89.

Staff are at the heart of public service delivery and the ability to deliver services efficiently depends on their commitment and engagement. Merging councils threatens this commitment and may actually result in reduced productivity as a result.

Size and the ‘new model’ for public services

In her blog post, Catherine discusses a new model for public services being developed by INLOGOV. Key to this new model is building capacity within communities themselves, facilitated by public bodies building stronger relationships with them10. But is merging authorities going to facilitate stronger relationships between communities and councils? Studies in Scandanavia suggest that larger political units have lower levels of non-electoral participation11, lower levels of political trust and lower satisfaction12. Larger councils are likely to feel more distant to citizens, with elected members representing larger numbers of constituents. The job of building trust will be all the more difficult, threatening any potential improvements in outcomes that the new model might deliver.

The new model discussion paper observes

Perhaps the behaviour which really needs to change first, so other change can follow, is that of people in the public sector.13

It is difficult to disagree. I am not arguing that things should stay the same. There is no doubt that the public sector has to get smarter in delivering better outcomes for less. It needs radical change in the way in which it approaches service delivery. It needs to work more closely with communities both to ensure outcomes are aligned with community aspirations and to enhance the capacity of communities themselves. It needs changes in approach and culture throughout. But creating larger authorities is unlikely to facilitate this change.

  1. Staite, C (2012). Making ends meet: what aren’t we talking about? [Online]. Available from: http://inlogov.wordpress.com/2012/12/03/making-ends-mee/ [Retrieved 1 April 2013] []
  2. Butler, P (2012). Birmingham City Council faces £757m bill to settle equal pay claims. The Guardian [Online], 12 November. Available from: http://www.guardian.co.uk/uk/2012/nov/12/birmingham-council-equal-pay [Retrieved 3 April 2013] []
  3. Babergh District Council and Mid Suffolk District Council (2011). Detailed business case for staff and service integration, and for the creation of a new council [Online]. Babergh and Mid Suffolk District Councils. Available from: http://apps.csduk.com/CMISWebPublic/Binary.ashx?Document=9600 [Retrieved 3 April 2013] []
  4. Boyne, G (1995). Population Size and Economies of Scale in Local Government. Policy & Politics, 23 (3): 213–222 []
  5. Wallis, JJ and Oates, WE (1988). “Decentralization in the public sector: an empirical study of state and local government.” In: Fiscal federalism: Quantitative studies [Online]. University of Chicago Press. pp 5–32. Available from: http://www.nber.org/chapters/c7882.pdf [Retrieved 4 April 2013] []
  6. Kahkonen, S and Lanyi, A (2001). Decentralization and governance: does decentralization improve public service delivery? PREM Notes 55 [Online]. The World Bank. Available from: https://openknowledge.worldbank.org/handle/10986/11382 [Retrieved 3 April 2013] []
  7. Alimo-Metcalfe, B and Alban-Metcalfe, J (2006). More (good) leaders for the public sector. International Journal of Public Sector Management, 19 (4): 293–315 []
  8. Bass, BM (1999). Two decades of research and development in transformational leadership. European Journal of Work and Organizational Psychology, 8 (1): 9–32 []
  9. Herold, DM, Fedor, DB, Caldwell, S and Liu, Y (2008). The effects of transformational and change leadership on employees’ commitment to a change: a multilevel study. Journal of Applied Psychology, 93 (2): 346–357 []
  10. Staite, C (2012). A new model for public services? [Online]. Birmingham: INLOGOV, University of Birmingham. Available from: http://www.birmingham.ac.uk/Documents/college-social-sciences/government-society/inlogov/discussion-papers/new-model-discussion-paper-1012-2.pdf [Retrieved 25 February 2013] []
  11. Rose, LE (2002). Municipal size and local nonelectoral participation: findings from Denmark, the Netherlands, and Norway. Environment and Planning C: Government and Policy, 20 (6): 829–851 []
  12. Denters, B (2002). Size and political trust: evidence from Denmark, the Netherlands, Norway, and the United Kingdom. Environment and Planning C: Government and Policy, 20 (6): 793–812 []
  13. Staite, C (2012). A new model for public services? [Online]. Birmingham: INLOGOV, University of Birmingham. Available from: http://www.birmingham.ac.uk/Documents/college-social-sciences/government-society/inlogov/discussion-papers/new-model-discussion-paper-1012-2.pdf [Retrieved 25 February 2013] []

Valuing outcomes in urban forestry

Eric Pickles says that local government must become more efficient1. It’s nothing new. Sir Peter Gershon was saying the same thing back in 20042 and increasing efficiency was an important driver of the public sector reforms of the Thatcher era3. We all need to work hard to increase productivity, but how do we know if we’ve succeeded?

Productivity goes up if the ratio of outcomes to inputs increases. Outcomes are not what is actually produced, but the satisfaction that a customer gains from these4. So in a bed factory the inputs are labour, materials etc, the outputs are beds and the outcomes are a good night’s sleep. Directly measuring the value of a good night’s sleep is quite hard, but the market gives us a pretty good idea by showing what a customer is prepared to pay for a bed. Consequently it’s common in the private sector to use outputs as a proxy for outcomes when assessing productivity.

The outputs and outcomes of local government are not generally traded in the market, so assessing their value is rather more difficult. Let’s consider how we might go about assessing the value of outcomes from one particular local government service, that of managing public trees.

There are some particular problems with this area. Firstly, trees grow slowly. The effects of changes in the way they are managed can take many years to become apparent. The effects of planting a new tree at a particular place will not be fully apparent for several decades, in much the same way as the effect of education on a person’s job prospects and salary lags well behind the actions of a school teacher. Secondly, the outcomes of managing public trees are many and disparate, and often difficult to disentangle from other causes. They can range from a sense of well being5 to cleaner air67, reduced crime8, reduced CO2 emissions9, flood mitigation10, increased economic activity11 and more12. Thirdly, whilst value in the private sector is usually viewed from the perspective of a consumer, many of these values are wider and can be characterised as being social or environmental13.

One potentially straightforward way to assess efficiency gains in the public sector is to assume that output is equal to input and to establish an indicator of service quality. A given increase in quality over the base line can then be quantified by reference to the baseline input14. However, given the complex nature of the outcomes of tree management, establishing an indicator that reflects overall performance would be difficult. Furthermore, the delayed impact suggests a need to be able to account for anticipated future benefits.

The concept of Social Return on Investment (SROI) has gained some support recently15. SROI uses financial proxies to monetise the outcomes of activities that have social benefits and can be used either evaluatively or to forecast future value16. If suitable proxies can be found it could offer a way forward.

The i-Tree system may help provide those proxies. Developed by the USDA Forest Service, i-Tree is a software modelling package that can be used to estimate the value of a range of benefits, including energy and CO2 saved, stormwater runoff, air quality and increases in house values17.  Its use so far in the UK has been limited and the two publicised studies, in Torbay and Edinburgh, restricted themselves to estimating the value of carbon storage and air quality1819. Benefits are context sensitive—the savings on air conditioning costs deriving from shade trees are likely to be rather more in San Fransisco than in Sheffield for example—and much of the work on monetising benefits has been done in the US. Further work is needed to adapt i-Tree to the UK context, but it shows some promise as a means of monetising the outcomes of urban forestry.

A significant problem remains, however. The UK valuation figures are based largely on avoided costs—societal costs of poor air quality, notional costs of “non-traded carbon”20. As such they do not represent the value that citizens attach to urban trees. One aspect of the US model, house prices, can be said to represent citizen based value in that it represents a revealed preference, but beyond that the views of citizens are largely absent from the system. Given that so much of the value of urban trees can be seen as social and environmental it may be appropriate that valuation is not based solely on citizens’ views, but is it right that those views are excluded altogether?

  1. Pickles, E (2011). Delivering better for less locally [Online]. Available from: https://www.gov.uk/government/speeches/delivering-better-for-less-locally [Retrieved 29 March 2013] []
  2. Gershon, P (2004). Releasing resources to the front line: independent review of public sector efficiency [Online]. London: HM Treasury. Available from: http://www.hm-treasury.gov.uk/d/efficiency_review120704.pdf [Retrieved 29 March 2013] []
  3. Hughes, OE (2012). Public management and administration: an introduction. 4th ed. Basingstoke: Palgrave Macmillan []
  4. Watt, P (2006). Measuring efficiency gains in local government that derive from improved service quality. Birmingham: INLOGOV, University of Birmingham []
  5. O’Brien, EA (2005). Publics and woodlands in England: well-being, local identity, social learning, conflict and management. Forestry, 78 (4): 321–336 []
  6. Donovan, RG, Stewart, HE, Owen, SM, MacKenzie, AR and Hewitt, CN (2005). Development and application of an urban tree air quality score for photochemical pollution episodes using the Birmingham, United Kingdom, area as a case study. Environmental Science & Technology, 39 (17): 6730–6738 []
  7. Nowak, DJ, Hirabayashi, S, Bodine, A and Hoehn, R (2013). Modeled PM2.5 removal by trees in ten U.S. cities and associated health effects. Environmental Pollution [Online], 178: 395–402. Available from: http://www.nrs.fs.fed.us/pubs/43676 [Retrieved 25 June 2013] []
  8. Kuo, FE and Sullivan, WC (2001). Environment and crime in the inner city: does vegetation reduce crime? Environment and Behavior, 33 (3): 343–367 []
  9. McPherson, EG and Simpson, JR (1999). Carbon dioxide reduction through urban forestry. General Technical Report PSW-GTR-171 [Online]. Berkeley, CA: USDA Forest Service, Pacific Southwest Research Station. Available from: http://www.fs.fed.us/psw/publications/documents/psw_gtr171/psw_gtr171.pdf [Retrieved 2 April 2013] []
  10. Xiao, Q and McPherson, EG (2002). Rainfall interception by Santa Monica’s municipal urban forest. Urban Ecosystems, 6 (4): 291–302 []
  11. Wolf, KL (2003). Public reponse to the urban forest in inner-city business districts. Journal of Arboriculture, 29 (3): 117–126 []
  12. Coder, KD (1996). Identified benefits of community trees and forests. University of Georgia Cooperative Service Forest Resources Publication FOR96-39 [Online]. Available from: http://warnell.forestry.uga.edu/warnell/service/library/for96-039/for96-039.pdf [Retrieved 2 April 2013] []
  13. Bovaird, T and Watt, P (2010). “Understanding value for money in local authority led public services: scoping a research programme.” In Sixth Transatlantic Dialogue: Rethinking Financial Management in the Public Sector. Siena, Italy. 24 June 2010 [Online]. Available from: http://www.academia.edu/1316427/Understanding_Value_for_Money_in_Local_Authority_Led_Public_Services_Scoping_a_Research_Programme [Retrieved 29 March 2013] []
  14. Watt, P (2006). Measuring efficiency gains in local government that derive from improved service quality. Birmingham: INLOGOV, University of Birmingham []
  15. Millar, R and Hall, K (2012). Social return on investment (SROI) and performance measurement. Public Management Review [Online]. Available from: http://www.tandfonline.com/doi/abs/10.1080/14719037.2012.698857 [Retrieved 1 April 2013] []
  16. Nicholls, J, Lawlor, E, Neitzert, E and Goodspeed, T (2009). A guide to social return on investment [Online]. London: Cabinet Office. Available from: http://www.neweconomics.org/sites/neweconomics.org/files/A_guide_to_Social_Return_on_Investment_1.pdf [Retrieved 1 April 2013] []
  17. Sarajevs, V (2011). Street tree valuation systems. Research Note FCRN008 [Online]. Edinburgh: Forestry Commission. Available from: http://www.forestry.gov.uk/pdf/FCRN008.pdf/$FILE/FCRN008.pdf [Retrieved 29 March 2013] []
  18. Rogers, K, Jarratt, T and Hansford, D (2011). Torbay’s urban forest: assessing urban forest effects and values. A report on the findings form the UK i-Tree Eco pilot scheme [Online]. Exeter: Treeconomics. Available from: http://www.itreetools.org/resources/reports/Torbay_UF_Report.pdf [Retrieved 25 March 2013] []
  19. Hutchings, T, Lawrence, V and Brunt, A (2012). Estimating the ecosystem services value of Edinburgh’s trees [Online]. Edinburgh: Forestry Commission. Available from: http://www.forestry.gov.uk/pdf/Edinburghi-treereport.pdf/$FILE/Edinburghi-treereport.pdf [Retrieved 3 April 2013] []
  20. Hutchings, T, Lawrence, V and Brunt, A (2012). Estimating the ecosystem services value of Edinburgh’s trees [Online]. Edinburgh: Forestry Commission. Available from: http://www.forestry.gov.uk/pdf/Edinburghi-treereport.pdf/$FILE/Edinburghi-treereport.pdf [Retrieved 3 April 2013] []